
Internet
Migrating from Prometheus to VictoriaMetrics: A Step-by-Step Guide

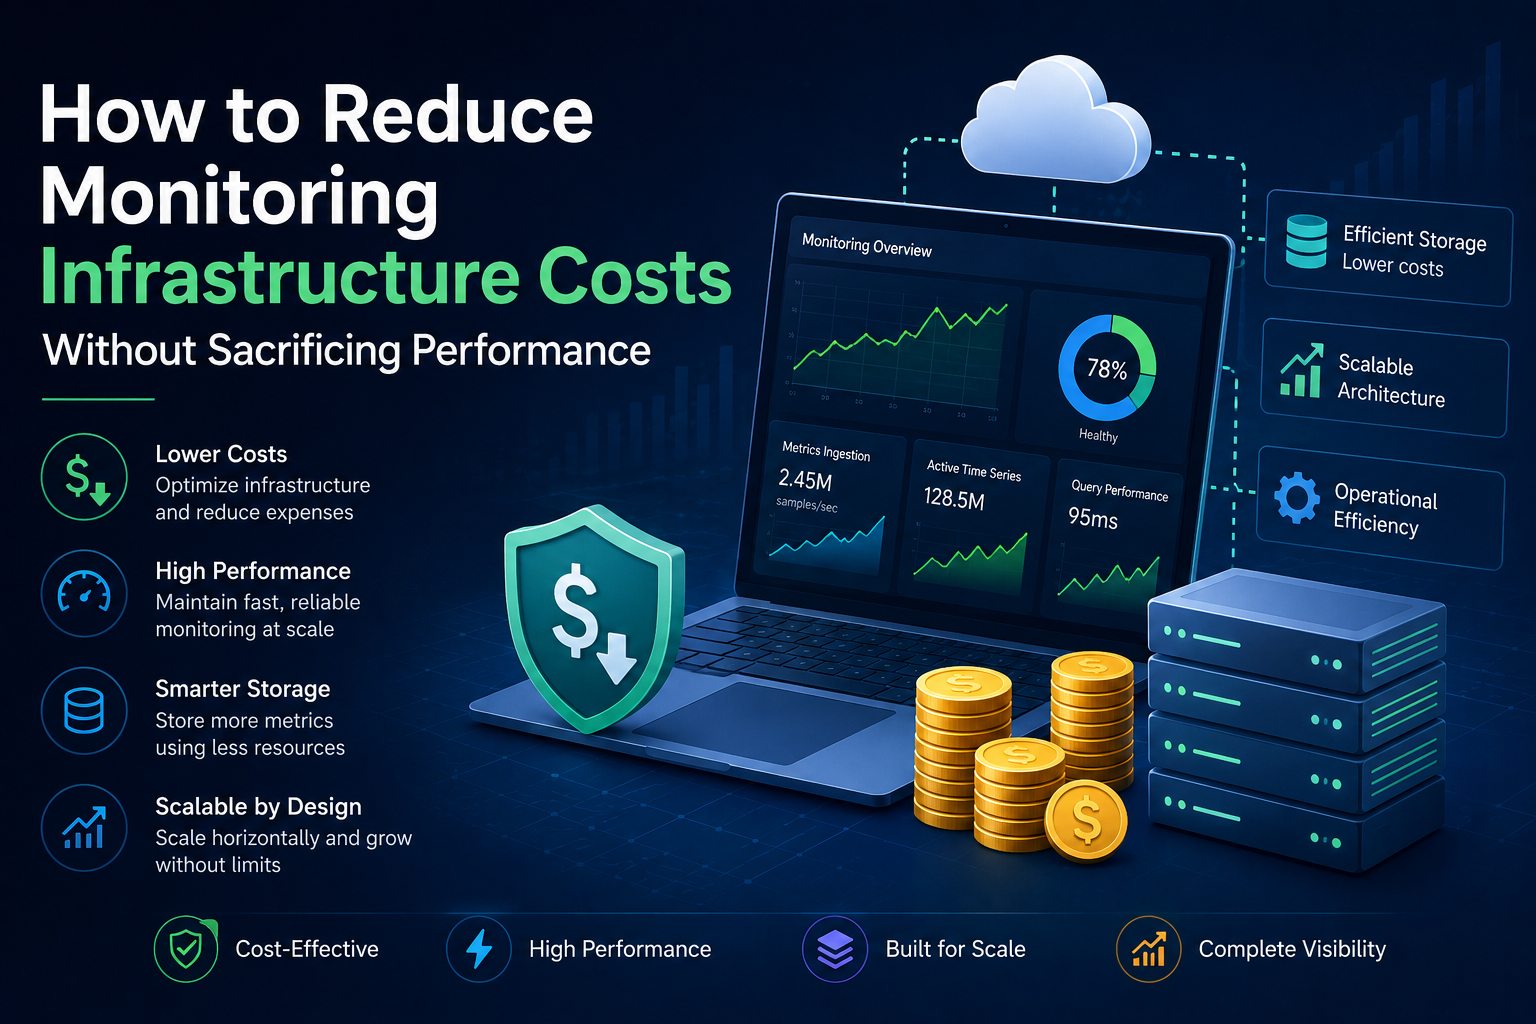
Modern cloud-native applications generate enormous volumes of metrics, making scalable monitoring more important than ever. While Prometheus has become the industry standard for metrics collection and alerting, many organizations eventually encounter challenges as their infrastructure grows. Increasing storage requirements, longer query times, higher resource consumption, and limited long-term retention often make it difficult for Prometheus to keep pace with enterprise-scale environments.
Fortunately, migrating to VictoriaMetrics offers a practical way to overcome these limitations without abandoning your existing monitoring ecosystem. Since VictoriaMetrics is fully compatible with Prometheus, organizations can continue using familiar tools such as Prometheus exporters, PromQL, Grafana, and Alertmanager while gaining improved storage efficiency, higher ingestion performance, and better scalability.
In this guide, we’ll walk through the migration process step by step, covering everything from preparation to validation. Whether you’re managing a single Kubernetes cluster or a large multi-cluster deployment, this guide will help ensure a smooth and successful VictoriaMetrics Migration.
Why Migrate from Prometheus?
Prometheus remains one of the most widely adopted monitoring solutions for Kubernetes and cloud-native environments. Its simplicity, extensive exporter ecosystem, and powerful PromQL language have made it the default choice for many DevOps and Site Reliability Engineering (SRE) teams.
However, as infrastructure expands, organizations often begin experiencing challenges that impact performance, scalability, and operational costs.
Some of the most common reasons organizations migrate include:
Growing Storage Costs
Large production environments can generate millions of samples every second. As historical metrics accumulate, storage requirements increase rapidly, leading to higher infrastructure costs and more complex storage management.
Limited Long-Term Retention
While Prometheus performs well for operational monitoring, retaining months or years of historical metrics often requires integrating additional remote storage solutions or third-party components. This increases both operational complexity and maintenance overhead.
Performance Challenges at Scale
As the number of monitored targets and active time series grows, query execution may become slower, dashboards may take longer to load, and monitoring infrastructure may require additional hardware resources to maintain acceptable performance.
Operational Complexity
Scaling Prometheus beyond a single instance frequently involves deploying federation, remote storage backends, or additional components such as Thanos or Cortex. While these solutions extend Prometheus capabilities, they also introduce additional infrastructure that must be deployed, monitored, and maintained.
For organizations experiencing these challenges, migrating to VictoriaMetrics provides a more scalable and resource-efficient approach while preserving compatibility with the existing Prometheus ecosystem.
What Is VictoriaMetrics?
VictoriaMetrics is a high-performance, cost-efficient time-series database designed specifically for monitoring and observability workloads. It is fully compatible with Prometheus, allowing organizations to improve scalability without rebuilding their monitoring stack.
Unlike traditional monitoring databases, VictoriaMetrics is optimized to handle massive metric ingestion rates while minimizing storage consumption and maintaining fast query performance.
Key advantages include:
- High-performance metrics ingestion
- Excellent storage compression
- Fast PromQL-compatible querying
- Long-term metrics retention
- Horizontal scalability
- Low resource consumption
- Simple deployment options
- Full compatibility with Prometheus exporters, Grafana, and Alertmanager
Organizations can start with VictoriaMetrics Open Source for lightweight or self-managed deployments and later expand to enterprise-grade deployments as monitoring requirements evolve.
Migration Prerequisites
Before beginning your migration, it’s important to understand your existing monitoring environment and prepare a migration plan.
A successful migration starts with documenting your current infrastructure and identifying any dependencies.
Before migrating, verify the following:
Inventory Your Monitoring Environment
Document:
- Prometheus server versions
- Exporters currently deployed
- Active scrape targets
- Recording rules
- Alerting rules
- Grafana dashboards
- Retention policies
- Remote storage integrations
Having a complete inventory helps ensure nothing is overlooked during migration.
Review Infrastructure Requirements
Estimate:
- Daily metrics ingestion rate
- Total active time series
- Historical data size
- Expected storage growth
- CPU and memory utilization
- Network bandwidth requirements
Understanding current resource usage will help determine the appropriate VictoriaMetrics deployment architecture.
Back Up Existing Data
Before making any infrastructure changes, create backups of:
- Prometheus configuration files
- Alerting rules
- Recording rules
- Grafana dashboards
- Historical metric data (if required)
Having reliable backups allows you to recover quickly if unexpected issues occur during migration.
Define Migration Goals
Clearly define what you expect to achieve after migration.
Common objectives include:
- Lower storage costs
- Faster query performance
- Longer data retention
- Simplified operations
- Higher availability
- Improved scalability
Well-defined goals make it easier to validate the success of the migration once completed.
Step 1: Deploy VictoriaMetrics
The first step is deploying VictoriaMetrics alongside your existing Prometheus environment.
Running both systems in parallel allows you to validate the new deployment without disrupting production monitoring.
Depending on your infrastructure, you can deploy VictoriaMetrics using:
- Docker
- Kubernetes
- Helm Charts
- Binary installation
- Distributed cluster deployment
Starting with a parallel deployment minimizes risk and provides an opportunity to compare results before switching production workloads.
Step 2: Configure Metric Ingestion
Once VictoriaMetrics is running, configure it to begin receiving metrics.
There are several approaches depending on your architecture:
- Continue using Prometheus to scrape metrics and forward them via remote write.
- Configure applications to send metrics directly where appropriate.
- Integrate Kubernetes service discovery for dynamic environments.
- Maintain existing exporters to avoid unnecessary application changes.
Because VictoriaMetrics is Prometheus-compatible, most existing instrumentation can remain unchanged, significantly simplifying the migration process.
Step 3: Migrate Historical Metrics
If retaining historical metrics is important for compliance, capacity planning, or trend analysis, you’ll need to migrate existing Prometheus data.
VictoriaMetrics provides migration tools that allow organizations to transfer historical metrics while preserving timestamps and labels.
During this stage, verify:
- Historical data integrity
- Label consistency
- Metric naming conventions
- Retention settings
- Data completeness
Migrating historical metrics ensures engineers maintain access to valuable operational insights after the transition.
Step 4: Connect Existing Dashboards and Alerting
One of the biggest advantages of VictoriaMetrics is its compatibility with the Prometheus ecosystem.
Most organizations can continue using their existing monitoring tools, including:
- Grafana dashboards
- Alertmanager
- PromQL queries
- Recording rules
- Existing exporters
- Kubernetes monitoring configurations
Update data source connections where necessary, then validate that dashboards display accurate metrics and alerts continue functioning correctly.
At this stage, both Prometheus and VictoriaMetrics can operate simultaneously, allowing engineering teams to compare performance, verify data accuracy, and build confidence before completing the migration.
Step 5: Validate Data Accuracy and Performance
Once VictoriaMetrics is receiving live metrics and your dashboards are connected, it’s time to verify that the migration has been successful. Validation ensures that the new monitoring platform is collecting accurate data and delivering the expected performance improvements before production workloads fully transition.
Begin by comparing metrics between Prometheus and VictoriaMetrics. Check that:
- Metrics are being collected from all configured targets.
- Labels and metadata remain consistent.
- Grafana dashboards display identical values.
- PromQL queries return the expected results.
- Alerting rules continue to trigger correctly.
It’s also important to monitor resource utilization during this phase. Compare CPU usage, memory consumption, storage growth, and query response times between the two environments. These benchmarks will help demonstrate the operational benefits of your VictoriaMetrics Migration while giving stakeholders confidence in the new deployment.
Running both systems in parallel for several days or weeks provides ample time to identify and resolve any inconsistencies before decommissioning Prometheus.
Step 6: Optimize Storage and Retention Policies
Migration is an excellent opportunity to review your existing data retention strategy.
Many organizations retain every metric indefinitely, leading to unnecessary storage costs and slower queries. Instead, define retention policies that align with business and operational requirements.
Consider implementing:
- Short-term retention for high-resolution production metrics
- Longer retention for aggregated historical data
- Separate retention policies for development and production environments
- Regular reviews of metric cardinality and storage growth
If you’re deploying VictoriaMetrics Open Source, take advantage of its efficient storage engine and high data compression to maximize retention without significantly increasing infrastructure costs. Optimizing retention policies immediately after migration helps maintain long-term performance and predictable storage utilization.
Step 7: Monitor the New Environment
Migration doesn’t end once data starts flowing into VictoriaMetrics. Ongoing monitoring is essential to ensure the platform continues to perform efficiently as your infrastructure grows.
Engineering teams should regularly monitor:
- Metrics ingestion rates
- Active time series
- Query latency
- Storage utilization
- CPU and memory usage
- Disk I/O
- Network throughput
Setting alerts for abnormal resource usage or unexpected ingestion spikes allows teams to identify potential issues before they impact production workloads.
Routine performance reviews also help optimize scrape intervals, retention policies, and infrastructure capacity as monitoring requirements evolve.
Step 8: Decommission Legacy Prometheus Infrastructure
After validating performance and confirming that all dashboards, alerts, and integrations operate correctly, you can begin retiring the legacy Prometheus infrastructure.
Before decommissioning:
- Verify that all historical data has been migrated (if required).
- Confirm every Grafana dashboard uses the new data source.
- Test all alerting rules.
- Validate recording rules and automation workflows.
- Ensure backup and disaster recovery procedures are in place.
Rather than shutting down Prometheus immediately, many organizations keep it available for a short transition period. This provides an additional safety net while engineering teams gain confidence in the new environment.
Once the transition is complete, removing unused Prometheus servers and associated storage reduces infrastructure costs and simplifies ongoing operations.
Best Practices for a Successful Migration
Following proven migration practices minimizes downtime and reduces operational risk.
Migrate in Stages
Avoid migrating every workload simultaneously. Begin with development or staging environments, validate performance, and gradually move production systems.
Keep Existing Instrumentation
Because VictoriaMetrics is fully compatible with Prometheus exporters and PromQL, there’s usually no need to modify application instrumentation. Reusing your existing exporters significantly simplifies the migration process.
Validate Before Switching Production
Always compare metrics, dashboards, and alerts between both systems before making VictoriaMetrics your primary monitoring platform.
Review High-Cardinality Metrics
Migration is the perfect opportunity to remove unnecessary labels and optimize metric cardinality, improving both storage efficiency and query performance.
Document the Migration Process
Maintain documentation covering deployment architecture, retention policies, alerting configurations, dashboards, and operational procedures. This makes future maintenance and troubleshooting much easier.
Plan for Future Growth
Choose an architecture that can scale with your business. Whether you’re operating a single Kubernetes cluster or a globally distributed infrastructure, planning ahead reduces the need for future re-architecture.
Organizations with demanding production environments may also benefit from Enterprise Support, which provides advanced capabilities and expert assistance for enterprise-scale deployments.
Common Migration Challenges
Even well-planned migrations can present challenges. Being aware of these issues beforehand helps ensure a smoother transition.
Data Consistency
Differences in scrape timing or retention settings may cause temporary discrepancies between Prometheus and VictoriaMetrics. Running both systems in parallel helps identify and resolve these issues.
High Metric Cardinality
Large numbers of unique labels can increase storage requirements and affect query performance. Reviewing label usage before migration helps optimize long-term efficiency.
Dashboard Validation
Complex Grafana dashboards should be tested carefully to confirm that every panel displays accurate data after updating the data source.
Alert Verification
Alerting rules should be thoroughly validated to ensure thresholds, notifications, and routing behave as expected after migration.
Capacity Planning
Although VictoriaMetrics is highly efficient, organizations should still estimate expected data growth and provision sufficient resources for future workloads.
Conclusion
Migrating from Prometheus to VictoriaMetrics is more than a technology upgrade—it’s an opportunity to build a monitoring platform that is better prepared for the demands of modern cloud-native infrastructure. By following a structured migration plan, validating each stage, and optimizing storage and monitoring practices, organizations can transition with minimal disruption while preserving their existing Prometheus ecosystem.
Whether your goal is to improve query performance, reduce storage costs, simplify operations, or support long-term metrics retention, VictoriaMetrics Migration provides a practical path forward. For organizations beginning their journey, VictoriaMetrics Open Source offers a powerful and flexible foundation. As monitoring environments expand and business requirements evolve, Enterprise Support helps ensure large-scale deployments remain reliable, secure, and highly available.
With the right planning and best practices, your migration can deliver immediate operational benefits while creating a scalable observability platform that continues to perform as your infrastructure grows.
Frequently Asked Questions (FAQs)
1. Can I migrate from Prometheus to VictoriaMetrics without downtime?
Yes. Most organizations deploy VictoriaMetrics alongside Prometheus, validate metrics and dashboards, and gradually transition production workloads. This phased approach minimizes risk and avoids service interruptions.
2. Will my existing Prometheus exporters continue to work?
Yes. VictoriaMetrics is fully compatible with Prometheus exporters, allowing you to continue collecting metrics without modifying your application instrumentation.
3. Do I need to recreate my Grafana dashboards?
No. Existing Grafana dashboards can usually be reused by updating the data source to VictoriaMetrics. Since it supports PromQL, most dashboards continue to function without major changes.
4. Can I migrate historical Prometheus data?
Yes. Historical metrics can be migrated using VictoriaMetrics migration tools, allowing organizations to preserve valuable operational data for reporting, compliance, and capacity planning.
5. What are the main benefits of migrating to VictoriaMetrics?
Organizations typically migrate to improve storage efficiency, increase ingestion performance, support long-term metrics retention, reduce infrastructure costs, and simplify large-scale monitoring deployments.
6. Is VictoriaMetrics suitable for Kubernetes environments?
Absolutely. VictoriaMetrics integrates seamlessly with Kubernetes and remains fully compatible with the Prometheus ecosystem, including Prometheus Operator, Grafana, Alertmanager, and Kubernetes service discovery.
7. Should I choose VictoriaMetrics Open Source or Enterprise?
VictoriaMetrics Open Source is an excellent choice for many self-managed environments. Organizations requiring advanced enterprise capabilities, enhanced scalability, or dedicated assistance can benefit from Enterprise Support.
8. How long does a typical migration take?
Migration time depends on the size of your monitoring environment, historical data volume, and deployment complexity. Smaller environments may be migrated within a few days, while large enterprise infrastructures often use a phased migration approach over several weeks to ensure a smooth transition.

How Instant Money Loan Apps Work: From Application to Disbursal

Single Door Fridge vs Double Door Fridge: Which Is Right for Your Indian Home in 2026?
Understanding AI Agent Architecture: From Automation to Autonomous Intelligence

How DMCA Ignored Hosting Help Adult Content Sites?

Other Alternatives to the Bigbunny Login Casino
Web UI Design Services, Custom Web App Development, or Local Product Design: Where to Start

Type-C to C vs Type A to Type C Cable: What’s the Difference?

How Executive Search Software Selects and Manages Senior Leadership Candidates

Data Science Course in Pune with Placement Support: From Classroom Training to Your First Job

Ethical Hacking Courses in Mumbai with Placement: Institutes, Duration, Fees & Jobs 2026
Web UI Design Services, Custom Web App Development, or Local Product Design: Where to Start
Other Alternatives to the Bigbunny Login Casino
Type-C to C vs Type A to Type C Cable: What’s the Difference?
How DMCA Ignored Hosting Help Adult Content Sites?
Understanding AI Agent Architecture: From Automation to Autonomous Intelligence
How Instant Money Loan Apps Work: From Application to Disbursal
Single Door Fridge vs Double Door Fridge: Which Is Right for Your Indian Home in 2026?


 Tech2 years ago
How to Use a Temporary Number for WhatsApp
- Business3 years ago
Sepatuindonesia.com | Best Online Store in Indonesia
- Social Media2 years ago
The Best Methods to Download TikTok Videos Using SnapTik
- Technology2 years ago
Top High Paying Affiliate Programs
- Tech2 years ago
Understanding thejavasea.me Leaks Aio-TLP: A Comprehensive Guide
- FOOD2 years ago
How to Identify Pure Desi Ghee? Ultimate Guidelines for Purchasing Authentic Ghee Online

 Instagram4 years ago
Free Instagram Auto Follower Without Login
- Instagram4 years ago
Free Instagram Follower Without Login